Do Indonesian forest fires affect Singapore's Air Quality?
This is my course project for the University of Washington’s Certificate in Data Science. Submitted June, 2017, at the completion of DS350: Methods for Data Analysis.
Background
Fires in Indonesia account for a significant source of global carbon emissions. 2015 witnessed a large spike in fires in Indonesia. NAA satellite data identified more than 100,000 fires in the first 10 months of 2015, of which nearly 24,000 occurred within a 10-day window during the peak burn (late September, 2015, see Fig. 1). This event led researchers to decry that Indonesian fires produced more daily carbon emissions than the entire US economy.
Fig. 1 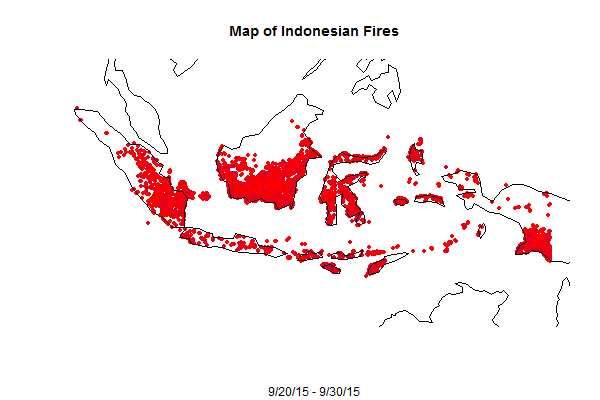
23,814 active fires were identified during the 2015 peak burn season. Color denotes fire brightness, a measure of intensity
The fires are the result of burning tropical rainforest for conversion to agricultural purposes, primarily oil palm and timber/pulpwood plantations. More than half of observed fires in 2015 occurred on peatland, a major source of stored carbon in the earth.
Beyond the ramifications for global climate change, such widespread fires generate smoke that is a source of local air pollution (see Fig. 2). I chose to investigate the extent to which the Indonesian fires affect Singapore’s air quality. I chose Singapore because of its proximity to Indonesia (Singapore and Jakarta are 1,000km apart), as well as because of the rich data availability.
Fig. 2 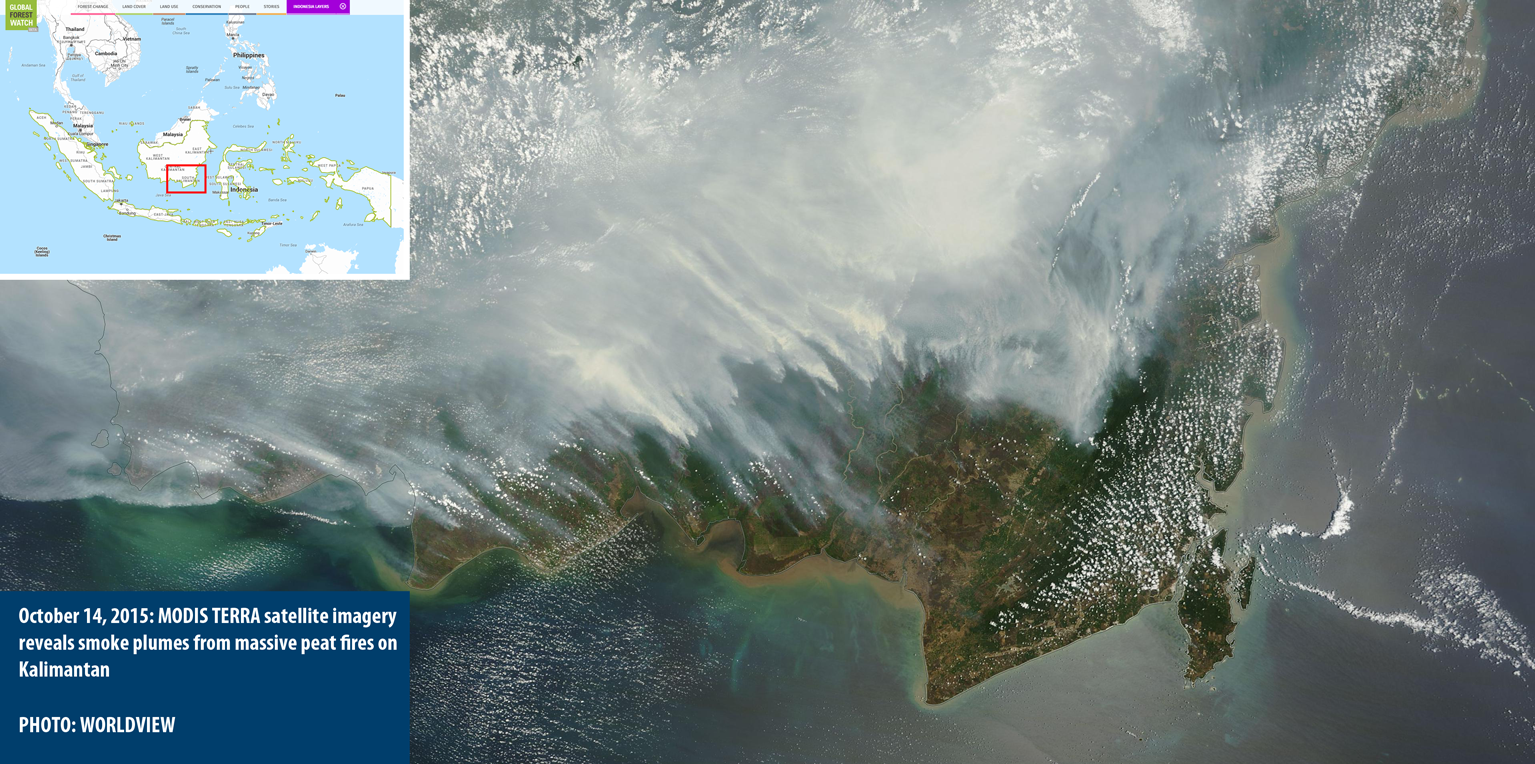
Satelline imagery of smoke from Indonesian fires on Oct. 14, 2015. Source.
Data
The period of analysis is 2014-2016. Singapore air quality data was scraped from Singapore’s National Environment Agency website. Data is hourly and was averaged at the daily level (see Fig. 3). (Source). Singapore’s average daily PSI is 52, within the “Moderate” range as defined by the Singapore government. However, there were 41 days in 2014-2016 where PSI exceeded 100, an “Unhealthy” level.
I downloaded daily weather data from the Meteorological Service Singapore for the Changi airport weather station. (Source). Monthly average sunshine hours and relative humidity were obtained from the Singapore government’s open data portal. (Source and Source). Finally, I manually downloaded historical Indonesia fire data from Global Forest Watch, which is based on NASA active fire satellite data. (Source). I summarized the Indonesia fire data at the daily level and subset to the period 2014-2016.
Fig. 3 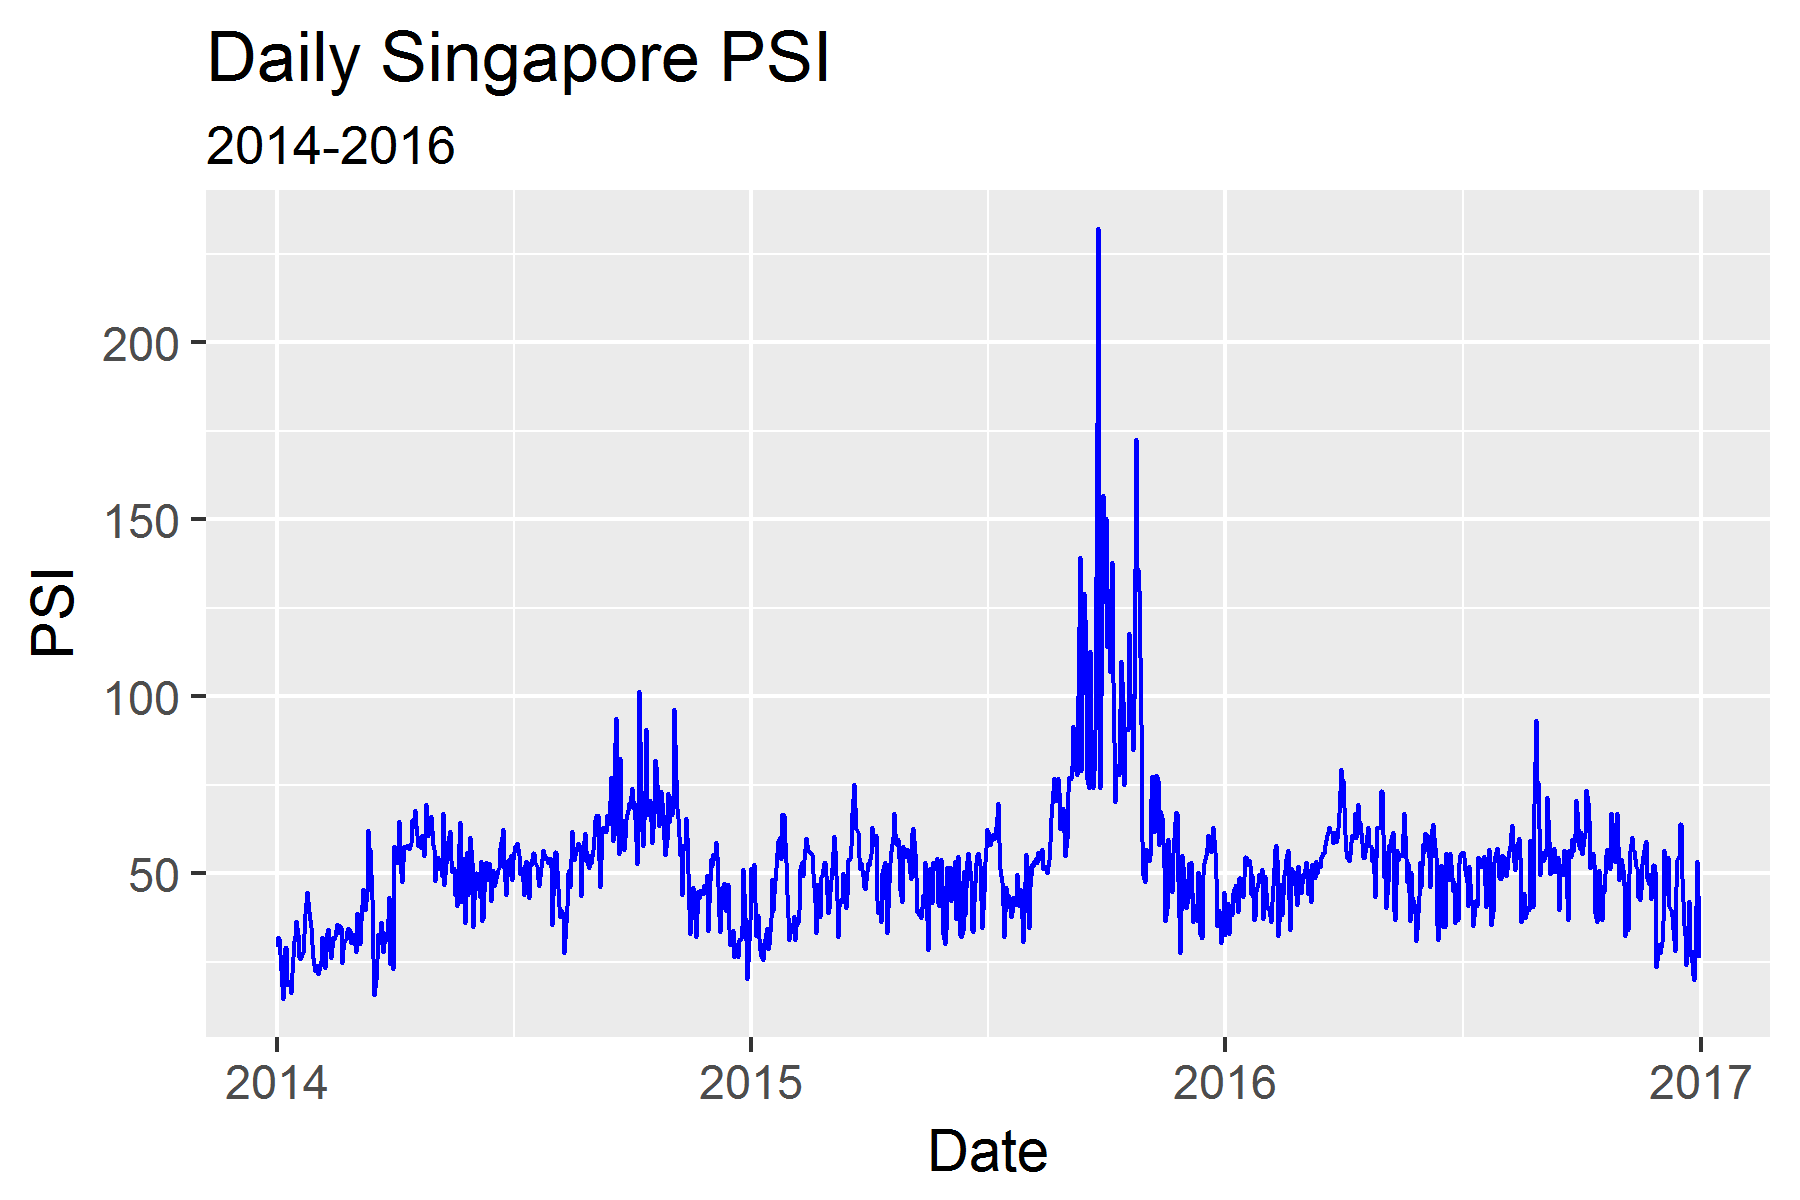
Singapore PSI, or Pollution Standards Index, measures the level of air particulates. PSI spiked during Sept-Nov 2015
At first glance, there is a close relationship between the number of active Indonesian fires and Singapore’s PSI. Fires even appear to be a leading indicator (See Fig. 4).
Fig. 4 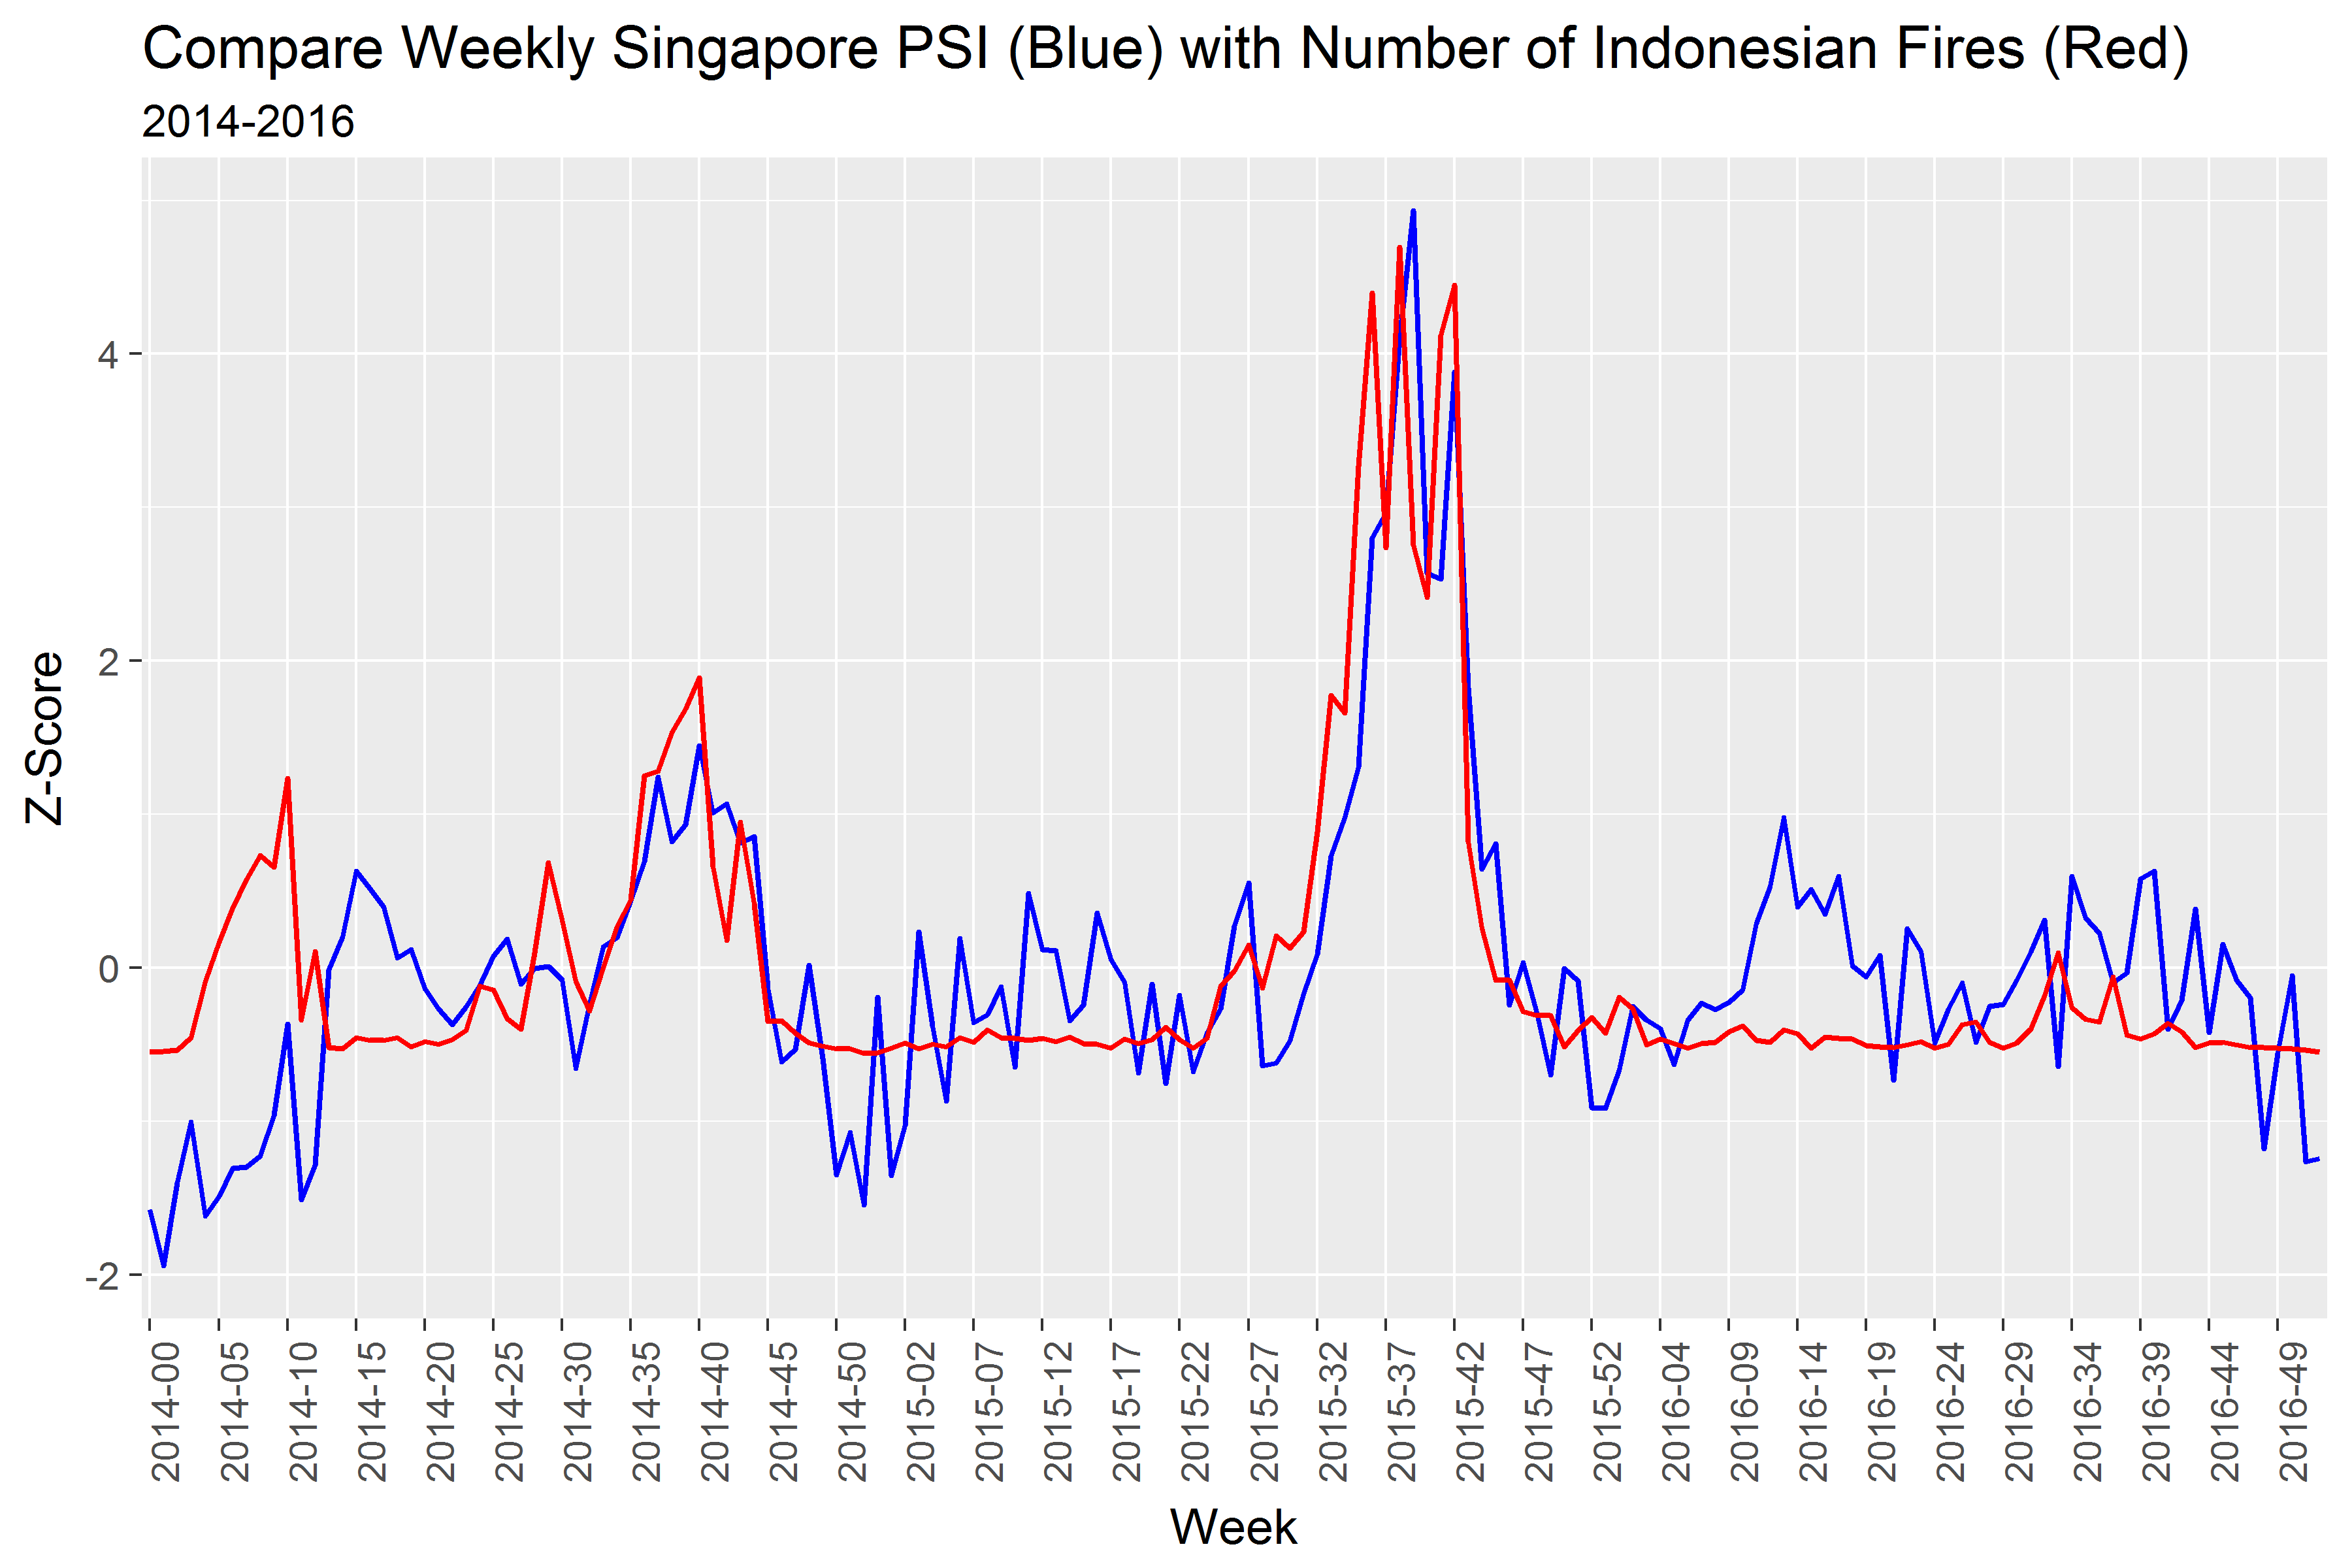
The weekly Indonesian fire count overlays Singapore’s PSI closely, particularly during peak burn season (Sept-Nov)
At the daily level, the fire count and PSI have a correlation coefficient of 0.554. Visual inspection shows that there is not as close a relationship between PSI and monthly sunshine and humidity levels (See Fig. 5).
Fig. 5 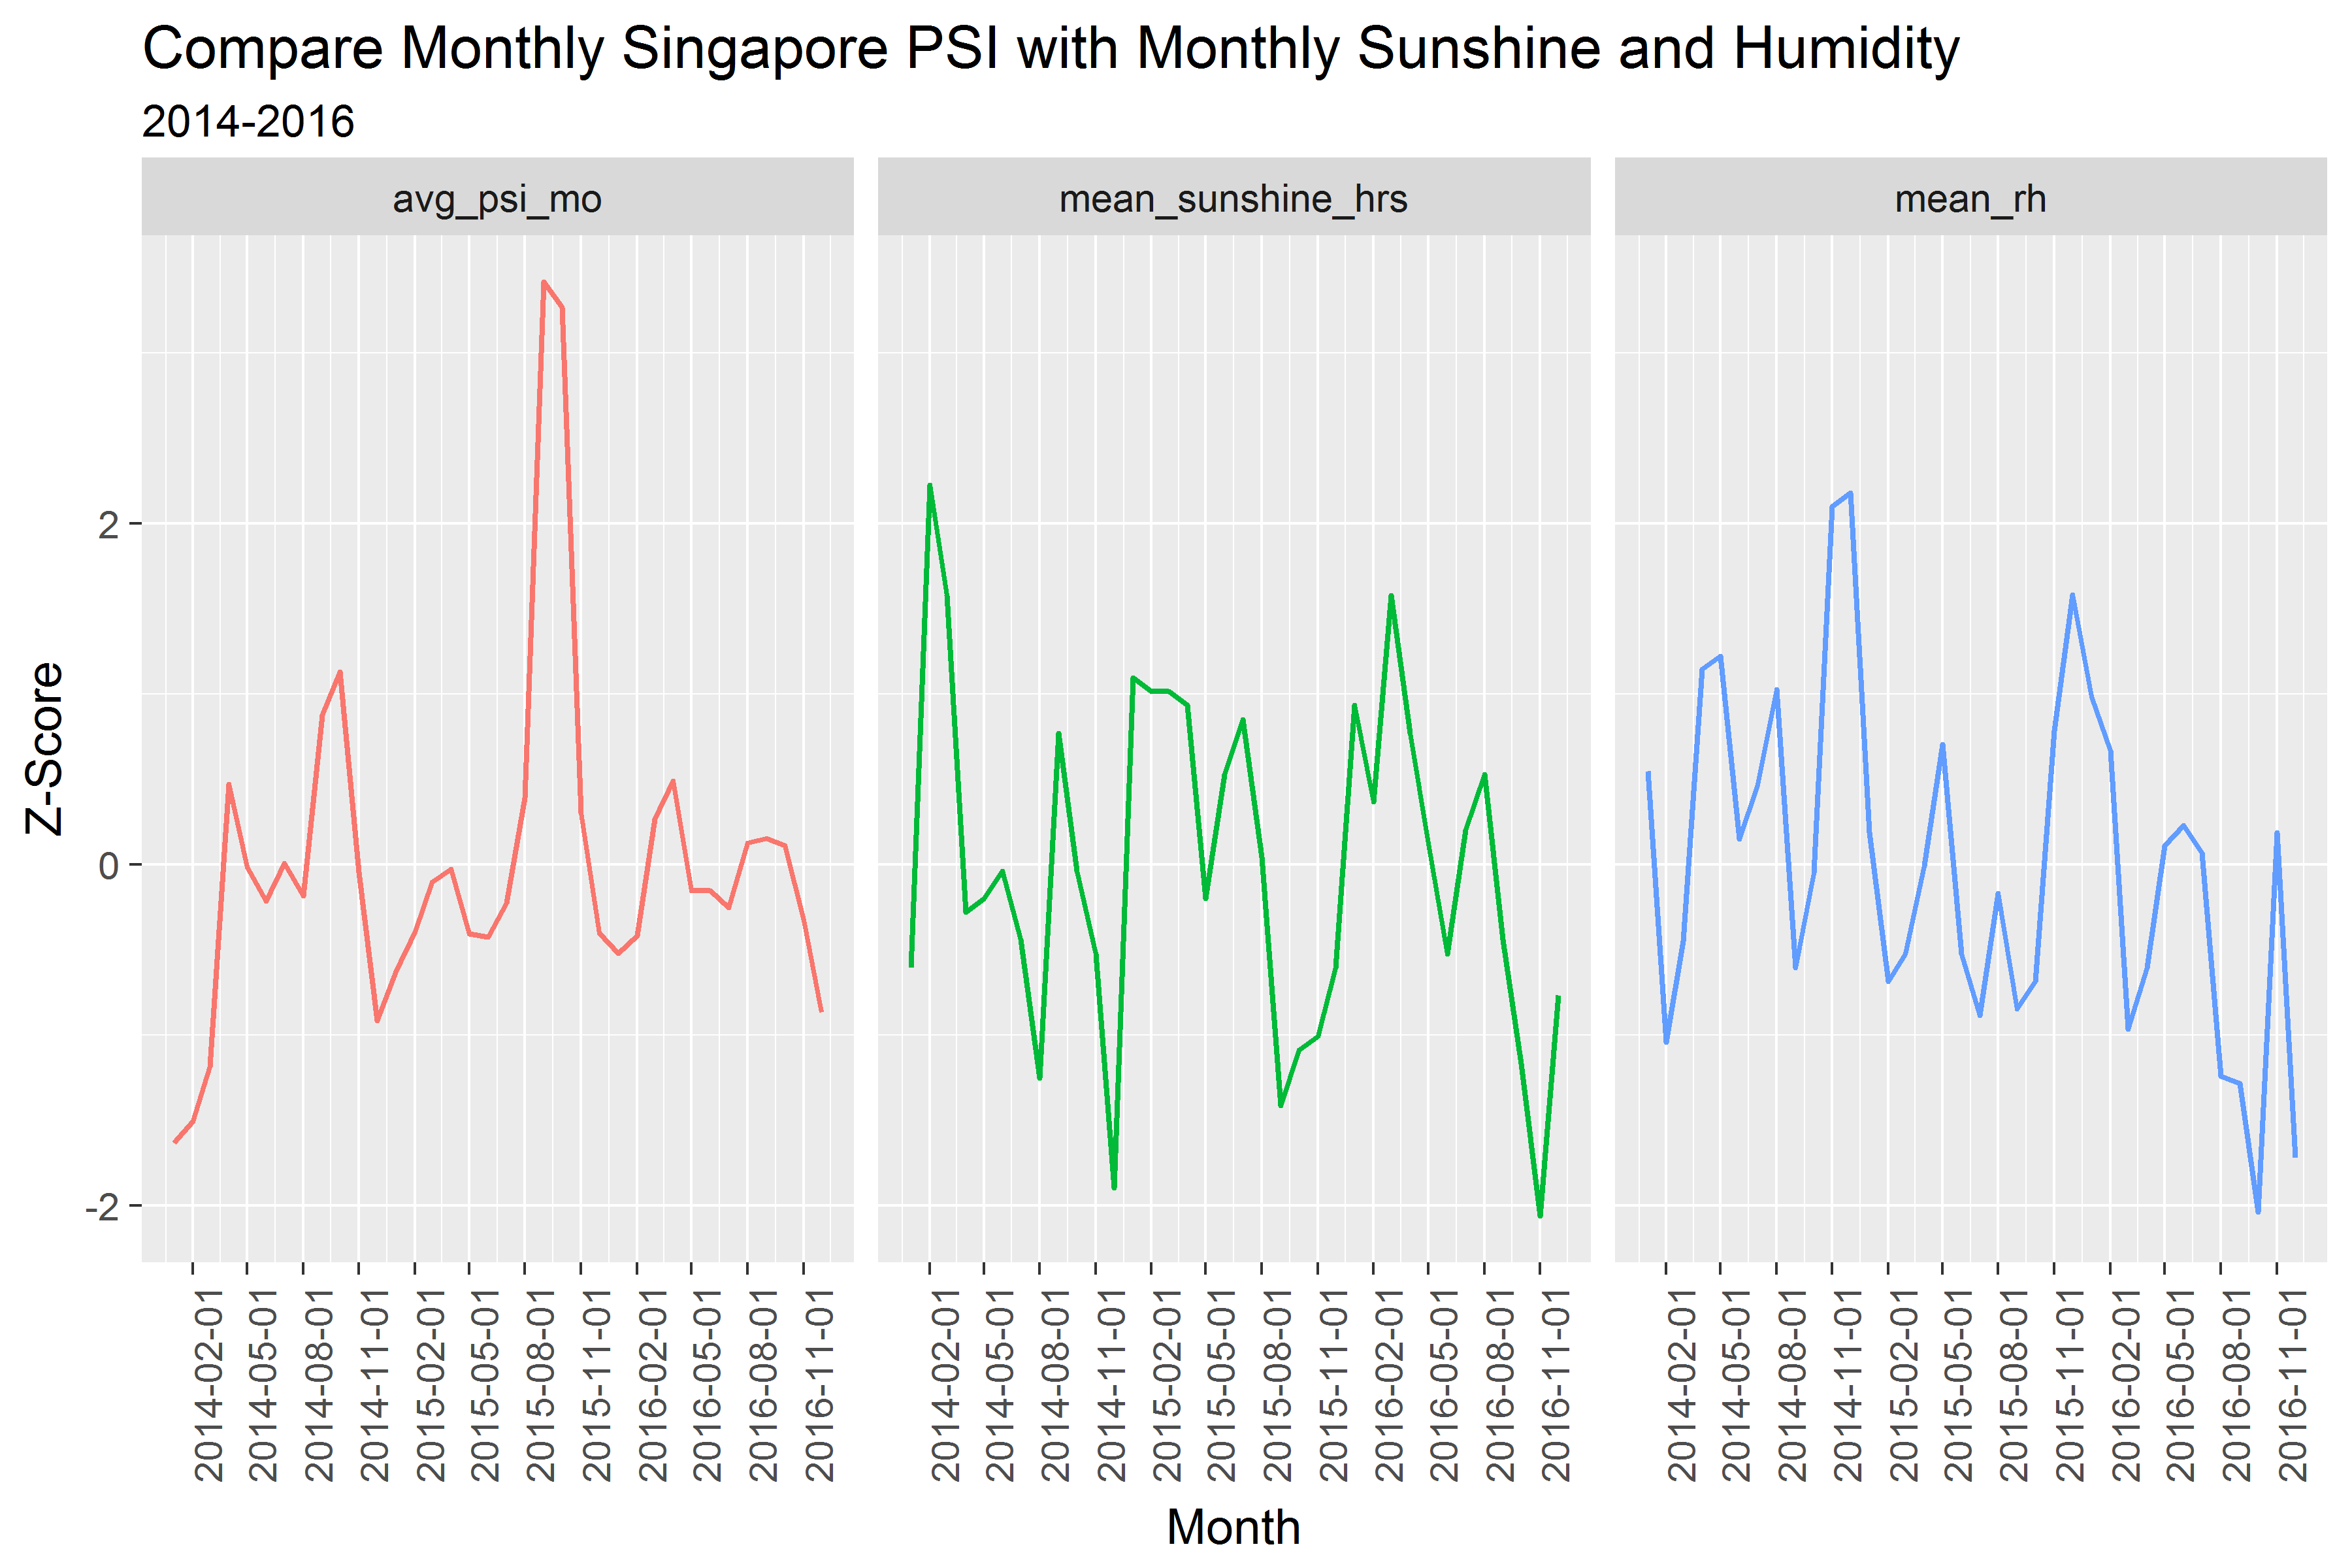
Analysis
My objective was to predict daily average 2015 Singapore PSI levels using a model trained on 2014 data. As mentioned, predictors included weather data (rainfall, temperature, wind speed, sunshine, and relative humidity), as well as Indonesian fire attributes (fire count, count of fires identified with ‘high confidence’, maximum and mean fire brightness). Absent from the predictors is wind direction for lack of data availability. Fig. 6 shows that wind direction likely an important predictor of Singapore PSI; wind blows from the south during the same months as Indonesia experiences its peak burn season (Sept-Nov).
Fig. 6 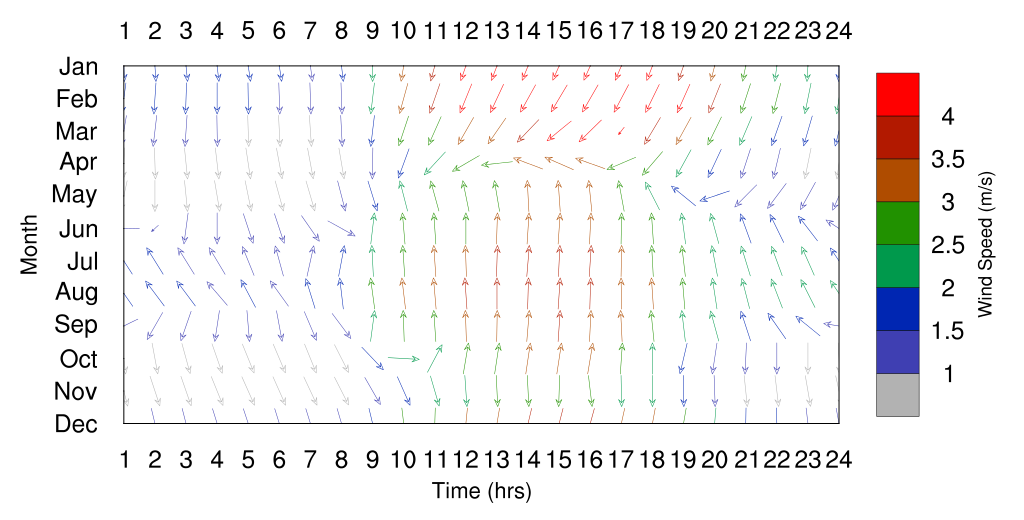
Singapore’s wind comes from the south (the direction of Indonesia) during daylight hours between May-Oct. (Source).
Additionally, I utilized moving averages, simple exponential smoothing, and Fourier transformation to investigate and visualize trend and seasonality in the PSI data. Ultimately I did not include moving averages or SES in the prediction because I was more interested in model interpretation - which factors affect Singapore’s PSI? - more so than predictive accuracy. Knowing that daily PSI is highly correlated with the previous day/week/month’s PSI levels is not a very interesting finding. As for seasonality, I found that seasonally-adjusting the PSI data based on a Fourier transformation masked the Indonesian fire count and resulted in poor predictions (it underestimates fires during Sept-Nov peak fire season).
Fig. 7 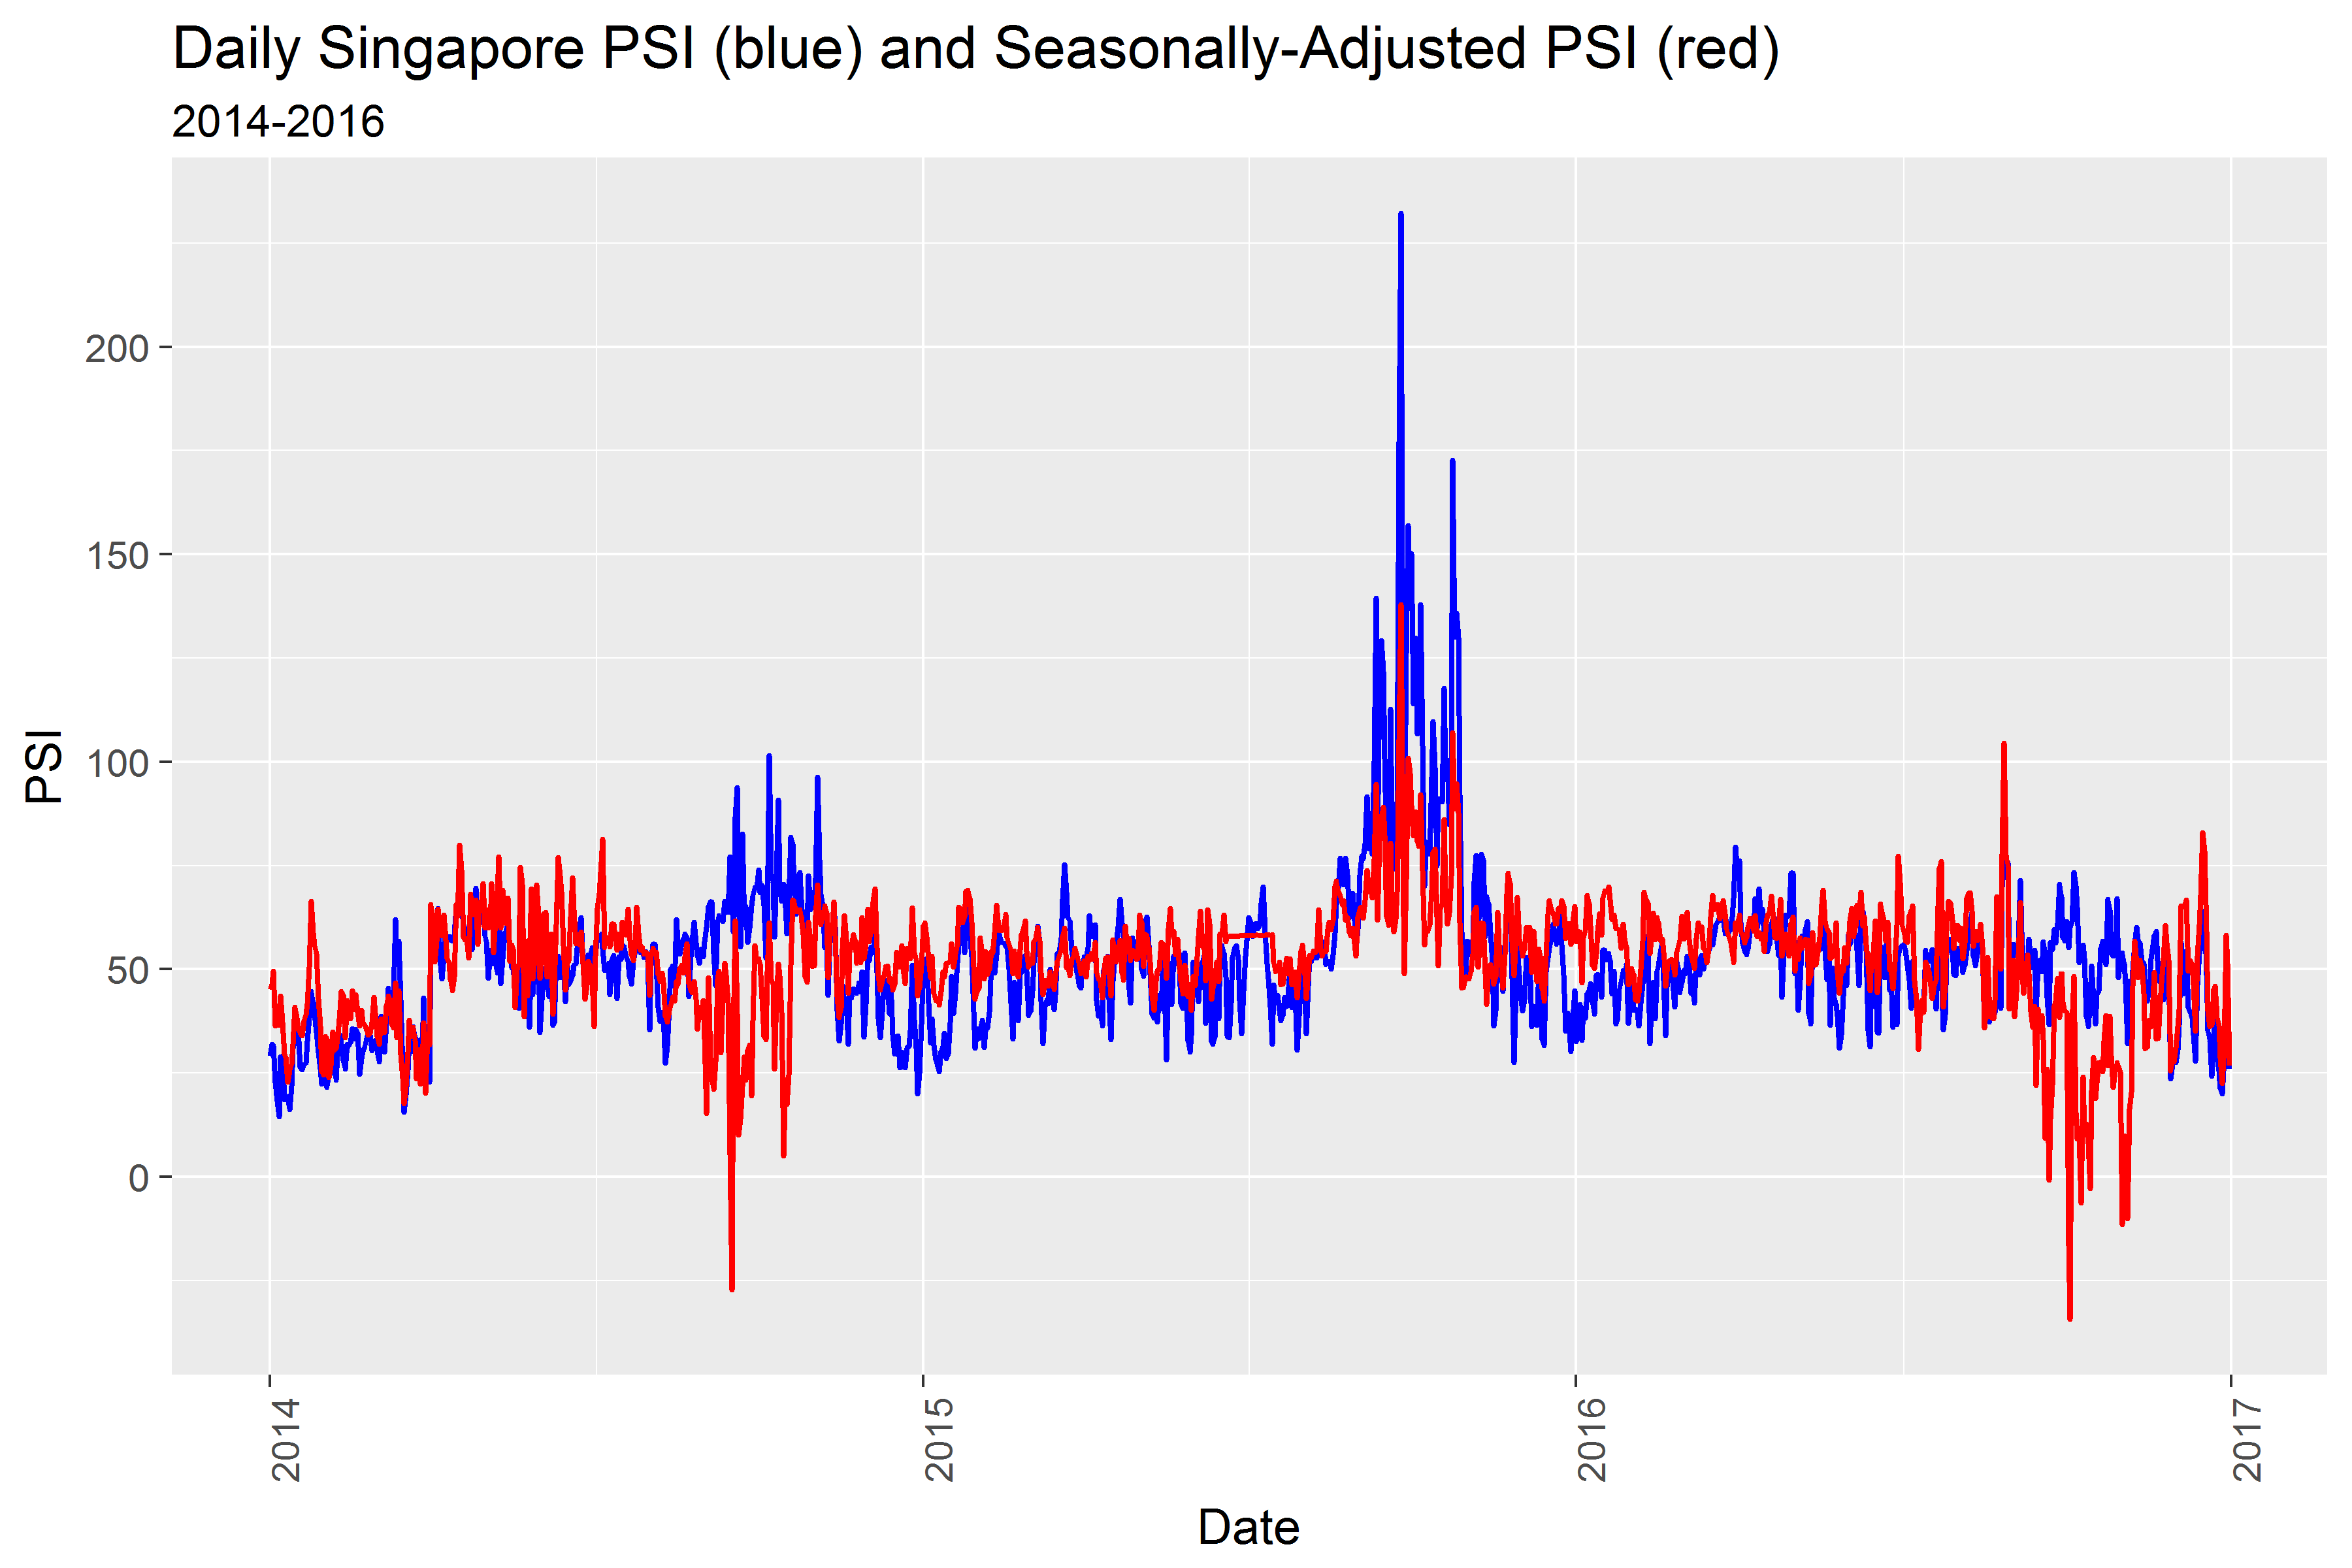
Seasonally-adjusted PSI is artificially-low during Sept-Nov and masks the fire count predictors in a linear regression.
Results and Interpretation
Stepwise linear regression found the daily fire count to be a key predictor of Singapore PSI, as well as the prior-day’s fire count (See Fig. 8). Week of year also has a large positive coefficient, meaning that as the week of the year increases so does Singapore PSI - this captures some of the seasonality given the higher PSI levels in Sept-Nov. Other predictors include rain, temperature, wind speed and hours of sunshine. Wind speed and hours of sunshine have negative coefficients - stronger wind and more hours of sunlight are correlated with lower PSI.
Fig. 8 
.
The model captures large movements in Singapore PSI but remains less predictive than I would like (see Fig. 9). Adjusted r-squared is 0.5484, and mean test error is 13.176, or 22.6% of the daily average PSI score. If given more time I explore adding new predictors (e.g., wind direction, measures of local pollution/emissions such as number of vehicle miles travelled). The prediction was more accurate for 2016 than for 2015, which may reflect how unusually-large the 2015 fires were. Finally, while the regression did underestimate PSI during Sept-Nov 2015 (as expected), it also underestimated PSI during Jan-Feb 2015 and 2016, which is typically during Singapore’s monsoon (rainy) season.
Fig. 9 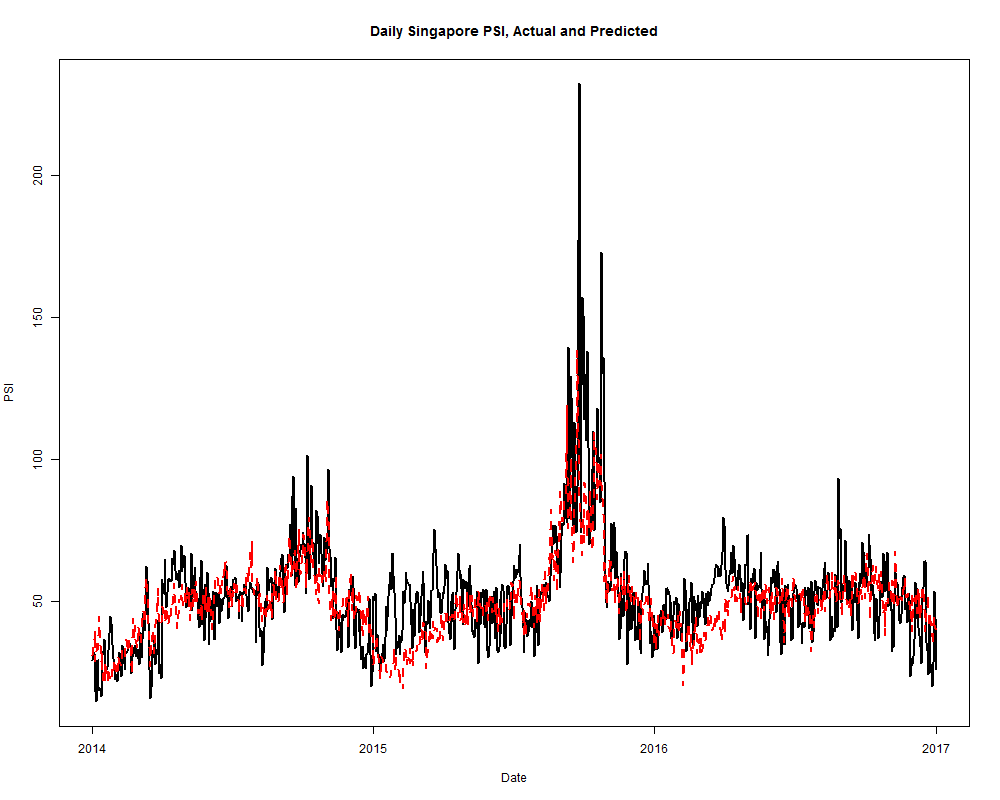
Actual PSI (black) and predicted PSI (red dashed line). 2014 is in-sample (training) data, while 2015-2016 is out-of-sample prediction.
Finally, I would seek to better control for trend and seasonality in the PSI data. I felt that three years was not very long to observe trend and so did not control for it. With seasonality, seasonally-adjusting PSI so far yielded a worse prediction. However, absolute test data residuals are relatively large (22.6% of mean daily PSI), and biased positively (See Fig. 10).
Fig. 10 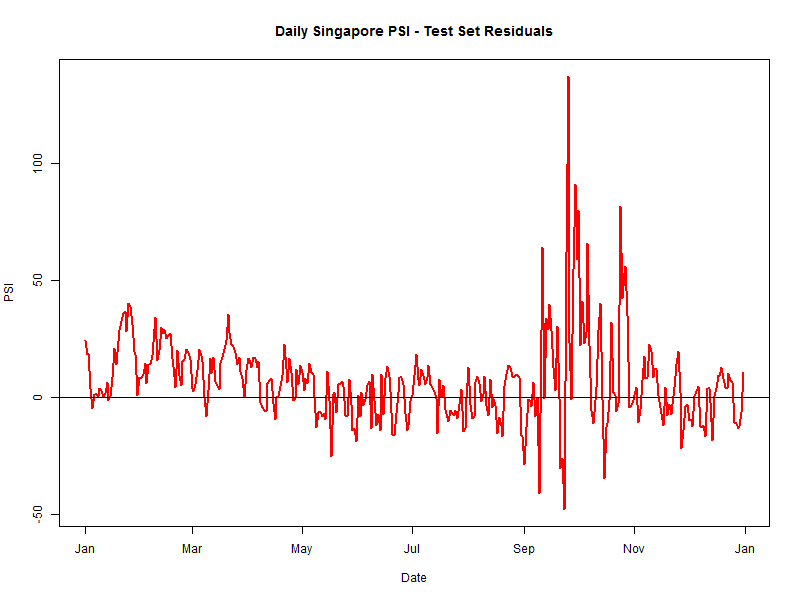
Takeaways
- Indonesian fires and daily weather are statistically-significant predictors of PSI
- Regression understates PSI during peak burn season (Sept-Nov)
- Want to explore methods to control for trend and seasonality to generate more accurate predictions