Presenting at Python Saigon
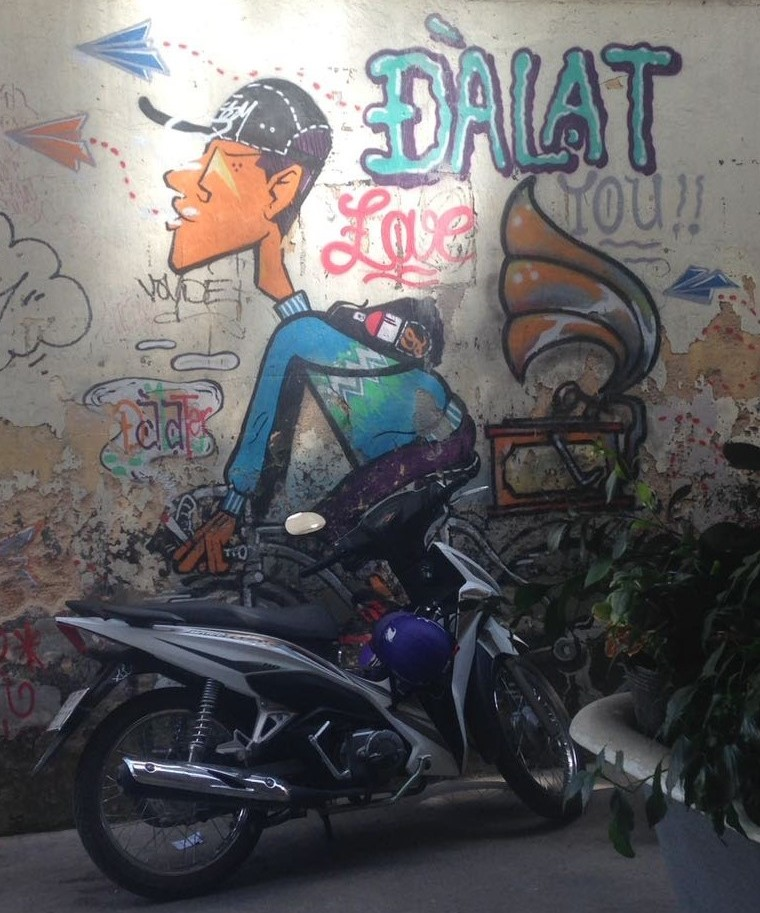
I had the opportunity to present on “Communicating Results in R” at the weekly Python Saigon Meetup, on Feb 25, 2017 in Ho Chi Minh City, Vietnam. We had a great discussion and shared data visualization tools and techniques. Materials are available on my GitHub, including a RPres slide deck with links and resources for learning R and data visualization. Presenting at Python Saigon

Solving a Riddle with a Simulation
Will the baby walk away? Nate Silver’s famous FiveThirtyEight blog posts a weekly riddle challenge. This week’s riddle is about a baby learning to walk. Classic Riddle Express: Your baby is learning to walk. The baby begins by holding onto a couch. Whenever she is next to the couch, there is a 25 percent chance that she will take a step forward and a 75 percent chance that she will stay clutching the couch.

DS250 - UW Intro to Data Science Course Project
Background This was my course project in Introduction to Data Science, the first course in a three-course certificate program through the University of Washington. I’m publishing it here, warts and all, because I think there are a few interesting facets to the analysis. Flexing my metaphorical mapping and visualization bicep with GGPLOT and GGMAP A first foray / experiment into using Principal Component Analysis (PCA) Leveraging multiple models - a decision tree for feature selection, PCA to address multicollinearity, and a linear regression to predict graduation rate A stark lesson in how hard it is to make sexy infographics!
Do Indonesian forest fires affect Singapore's Air Quality?
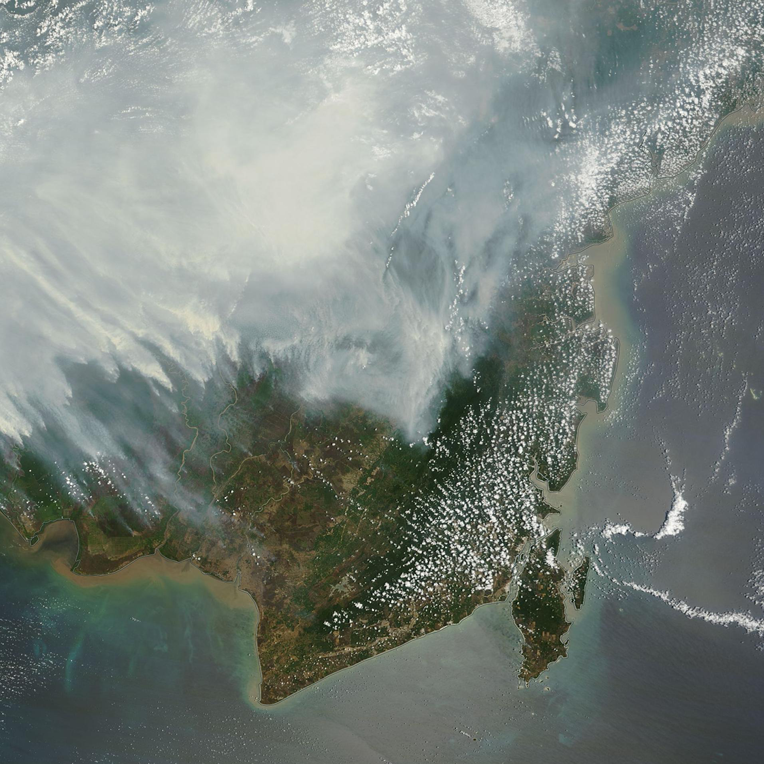
This is my course project for the University of Washington’s Certificate in Data Science. Submitted June, 2017, at the completion of DS350: Methods for Data Analysis. Background Fires in Indonesia account for a significant source of global carbon emissions. 2015 witnessed a large spike in fires in Indonesia. NAA satellite data identified more than 100,000 fires in the first 10 months of 2015, of which nearly 24,000 occurred within a 10-day window during the peak burn (late September, 2015, see Fig.
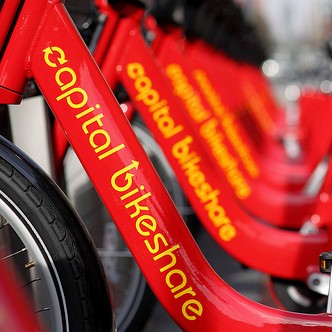
When is Capital Bikeshare faster than Uber?
This is my Capstone Project for the University of Washington’s Certificate in Data Science. Submitted December, 2017, at the completion of DS450: Deriving Knowledge from Data at Scale. 1. Introduction Problem Statement When is it faster to bicycle or take Uber in Washington D.C.? When you rent a bikeshare, how long will it take to get to your destination?

Build a Custom Website with R Studio and GitHub Pages, Part 1
One of R Studio’s best features is the ability to publish analyses in a reproducible, visually-appealing way using R Markdown. R Markdown weaves together text and R code chunks in an easy-to-use interface, allowing you to publish reports, presentations, and dashboards across formats – PDF, HTML HTML slides, books, websites, and blogs. I first began using R Markdown to produce slide decks for work as an alternative to Powerpoint. R Markdown’s advantage is that should my data or code change, the changes are instantly reflected in the output by simply re-“knitting” the R Markdown file.