Solving a Riddle with a Simulation
Will the baby walk away?
Nate Silver’s famous FiveThirtyEight blog posts a weekly riddle challenge. This week’s riddle is about a baby learning to walk.

Classic
Riddle Express:
Your baby is learning to walk. The baby begins by holding onto a couch. Whenever she is next to the couch, there is a 25 percent chance that she will take a step forward and a 75 percent chance that she will stay clutching the couch. If the baby is one or more steps away from the couch, there’s a 25 percent chance that she will take a step forward, a 25 percent chance she’ll stay in place and a 50 percent chance she’ll take one step back toward the couch.
In the long run, what percent of the time does the baby choose to clutch the couch?
That’s a head scratcher! I am not sure how to calculate this. Luckily, I don’t have to.
Instead, let’s simulate what happens with a virtual baby, “Cassidy” and virtual couch using R. We can run through the same simulation many times, varying the number of steps the baby takes, in order to see what happens in the long term.
Generate Random Number
First, I can have R randomly choose whether Baby Cassidy stays still, steps forward, or steps backwards by randomly sampling one number from a set of numbers that replicate the probabilities listed in the riddle.
Here, I’m simulating lil’ Cass at the couch - randomly generating a number that is either a 0 (baby stays at couch) or a 1 (baby steps forward). As specified in the riddle, there is a 75% chance of staying at the couch (0) and 25% chance of stepping forward (1):
sample(c(0,0,0,1),1)The probabilities change when the little tyke is no longer at the couch. Now we’re told that there is a 25% chance of stepping forward (+1), a 25% chance of standing still (0), and a 50% chance of stepping backwards:
sample(c(1,0,-1,-1),1)If Else
Baby Cassidy is more adventurous when she’s not clinging to the couch. If at the couch, do X. If away from the couch, do Y. This sounds like an if-else statement.
In order to know which probabilities to apply, we have to know where Cass is. That’s stored in the variable “c”, which is updated after every step. If c equals 0, we know the tot is at the couch, and c>0 denotes the number of steps away from the couch.
You can also see the random number generator (“r”) at work - that’s how we’re “simulating” what she will do next.
Finally, the variable “y” is a list that records which action Cass takes at each step.
We loop over the if-else statements “x” number of times times – if x equals 100, that means we get to observe Cass’ steps 100 times in our simulation.
  c <-  0 #location - 0 = at couch, >0 = number of steps away from the couch
  y <- list() #empty list to record location at each iteration
  r <- 0 # 0 = stay still, 1 = step forward, -1 = step back
  for(i in 1:x){
    if(c==0){
      r <- sample(c(0,0,0,1),1)
      c = c+r
      y <- c(y,c)
    }
    else if(c>0){
      r <- sample(c(1,0,-1,-1),1)
      c = c+r
      y <- c(y,c)
    }
Putting it all together
So what’s the answer to the riddle?
I ran the simulation 100 times, varying the number of steps that we get to observe Baby Cassidy, from 10 steps to 1,000 steps. That allows us to see what she does in the “long term”.
The code below takes our if-else statements, loops over them 10 to 1000 times depending on the simulation. It stores each simulation’s results in a list (“l”), converts that list to a dataframe (“m”), and outputs the “percentage of time the baby is at the couch.” Lastly, I chart the data to see how the simulation behaves as we increase the number of steps.
library(ggplot2)

v <- seq(10,1000,10) #100 simulations ranging from 10 to 1000 steps per simulation
l <- list() #empty list to store average location result

for(x in v){
  c <-  0 #location - 0 = at couch, >0 = number of steps away from the couch
  y <- list() #empty list to record location at each iteration
  r <- 0 # 0 = stay still, 1 = step forward, -1 = step back
  for(i in 1:x){
    if(c==0){
      r <- sample(c(0,0,0,1),1)
      c = c+r
      y <- c(y,c)
    }
    else if(c>0){
      r <- sample(c(1,0,-1,-1),1)
      c = c+r
      y <- c(y,c)
    }
  }
  y <- as.data.frame(t(as.data.frame(y)))
  y$loc <- ifelse(y$V1==0,1,0) #1 means away from couch, 0 means couch

  l <- c(l,mean(y$loc)) #mean loc == percent of the time baby is at couch
}

l <- unlist(l)
m <- as.data.frame(cbind(v,l))
colnames(m) <- c("iterations","pct_couch")

#View data frame with simulation results
head(m)
## iterations pct_couch
## 1 10 0.7000000
## 2 20 0.5500000
## 3 30 0.4666667
## 4 40 0.7000000
## 5 50 0.7600000
## 6 60 0.5833333#generate a chart to visualize the percentage of time at the couch
ggplot(m,aes(x=iterations, y=pct_couch)) +
geom_point() +
geom_abline(intercept=weighted.mean(m$pct_couch,m$iterations),slope=0, colour="red", size=1) +
labs(title="How often will the baby be at the couch?") +
scale_x_continuous(name="Iterations") +
scale_y_continuous(name="Percent of the time at the couch") 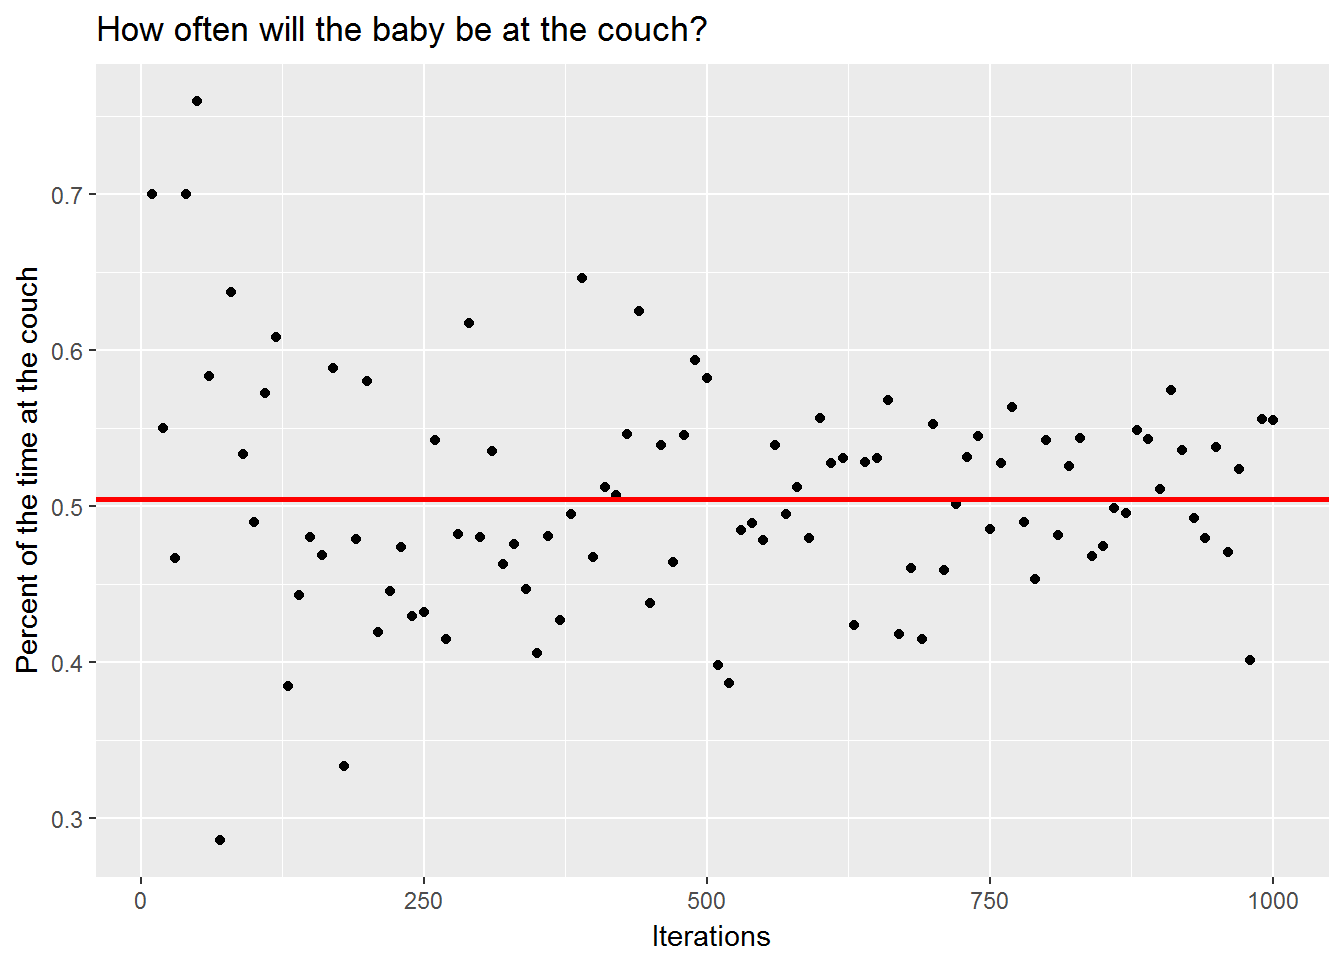
It looks like as the number of steps in the simulation increases, Cass tends to spend 50% of the time away from the couch. Cheeky bugger!